When One Candle Sets Both Extremes
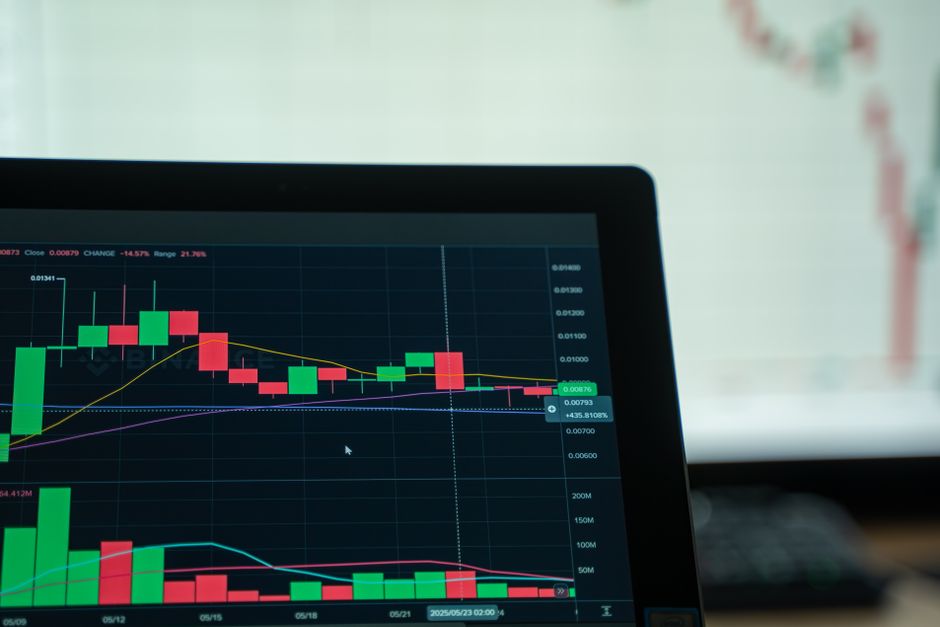
Drop to a lower timeframe before drawing a single line. When one candle on the 5 minute chart contains the entire opening range, the rectangle on the screen is describing sixty seconds of activity and thirteen minutes of nothing, and at that resolution the two are indistinguishable. The breakdown sitting on orb trading setups beekeeping for beginners lists these sessions apart from ordinary ones for that reason, because a level nothing has confirmed still has to carry a stop loss, and sizing against it is where the damage happens.
Why It Happens
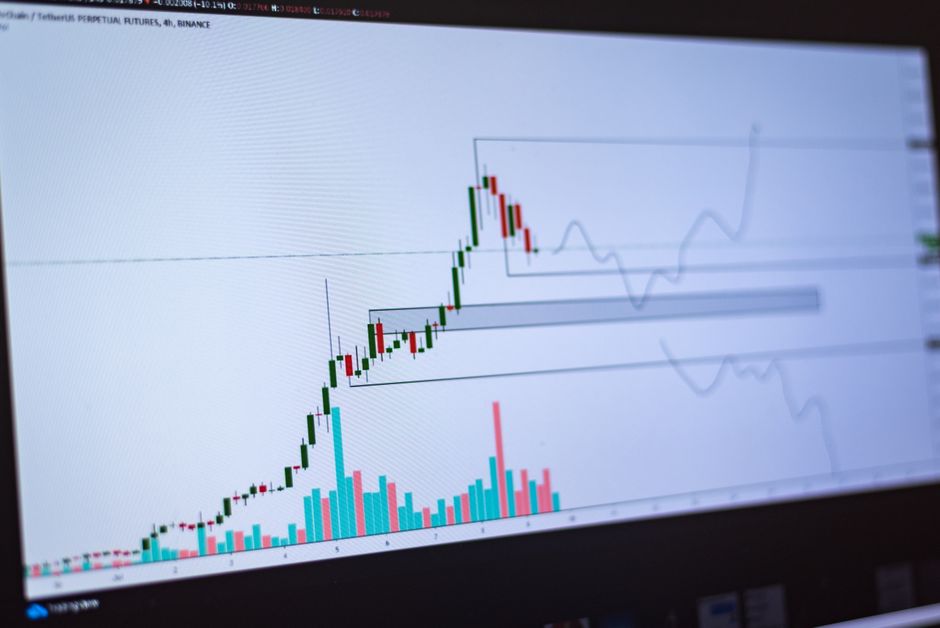
Three causes account for most of them. A scheduled release at the cash open, a gap that fills violently in the first minute, and a thin instrument where one institutional order clears several price levels at once. The cause matters because it changes what the level means, and the calendar answers the first one before the session starts.
The Level Has No History

A boundary formed by a single candle has not been offered to the market twice. Nobody defended it, nobody rejected it more than once, and there is no accumulated position sitting at it. Compare that with a range high tested three separate times, where a break clears real orders. The first is a line on a chart. The second is a level.
The practical consequence is that follow through is unreliable. The break happens, the ticks print, and then there is nothing behind it.
Sizing Against an Unconfirmed Level
The stop has to go somewhere, and the two candidates are the far side of the range and the far side of the candle body. On a single candle range those are frequently the same distance, which means the stop is wide and the position size falls. Taking the normal size against a wider stop is the error, and it is common precisely because the range looks small on the chart when the candle is tall.
Use the Lower Timeframe Structure
The one minute chart inside that single candle usually contains a smaller structure: a push, a pause, a second push. The pause is a real level, it was formed by more than one print, and it is often a better boundary than either extreme of the parent candle. Marking it takes thirty seconds and gives the trade something to reference.
The Default Is to Wait
A 30 minute range on the same morning frequently resolves the problem, since it includes the quiet period after the initial move and produces a boundary with some testing in it. Waiting costs the first break, which on these sessions is the break most likely to fail. Recording both outcomes for a quarter is the only way to settle it for a given instrument, and the log field is one line: whether one candle set both extremes.