The Three Opening Range Shapes That Behave Differently
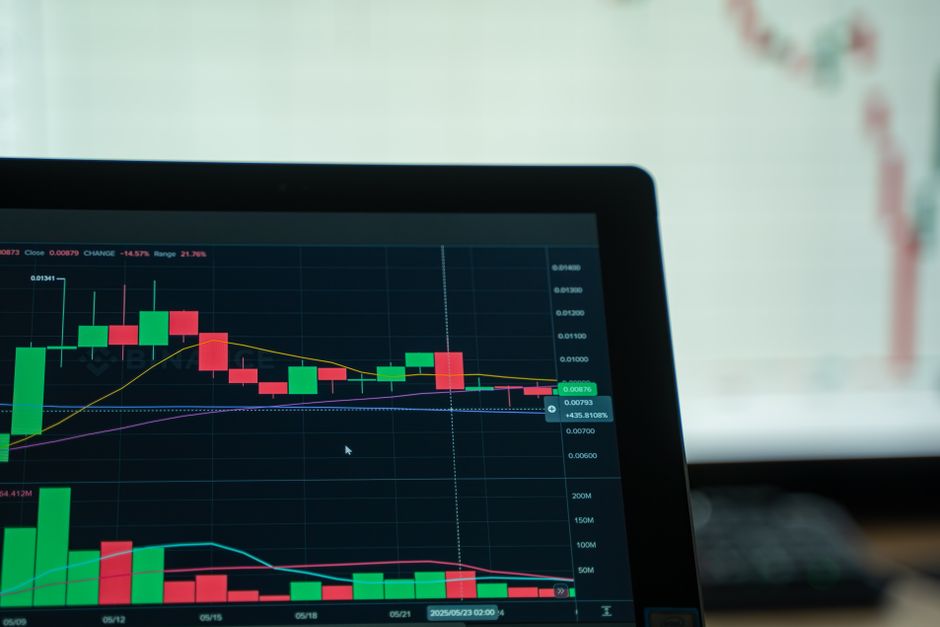
A completed opening range is usually reduced to two numbers, a high and a low. That reduction throws away most of what happened during the period. The path price took to produce those two numbers describes who was in control and how contested the level actually was, and ranges with the same height routinely resolve in opposite ways depending on that path.
The Balanced Range
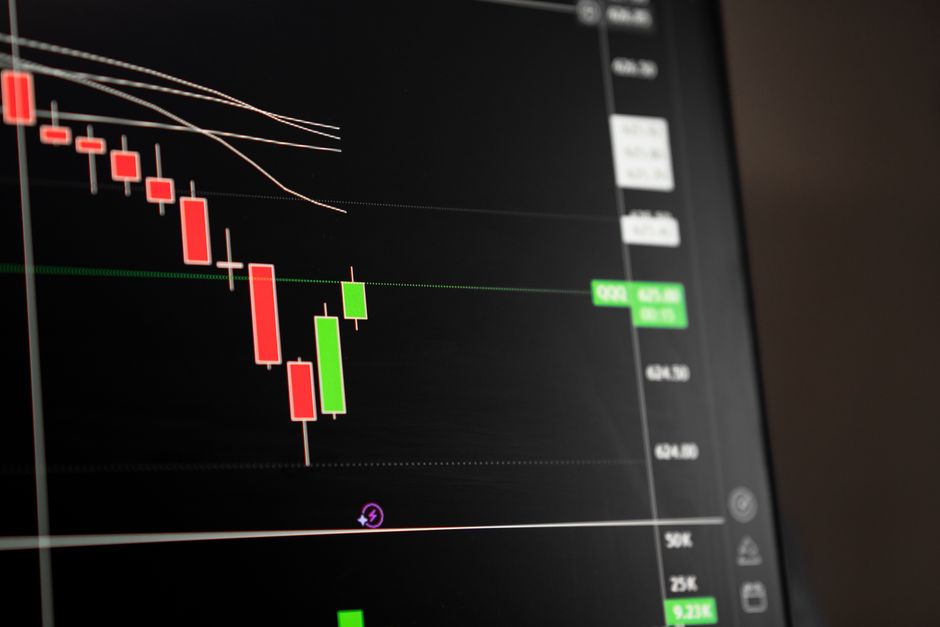
The first shape is the one textbooks draw. Price oscillates across the middle of the period, touches both edges more than once, and finishes somewhere near the centre. Neither side established control. The high and the low were both tested and both held, which means both are levels that real participants defended rather than incidental extremes.
This shape produces the most honest breakout signal, because a break of either edge represents a genuine change from what the period established. It also produces the widest stop if you place it at the opposite edge, since the range is being used at its full height. The trade is cleaner and the risk is larger, and those two facts arrive together.
The One Sided Range
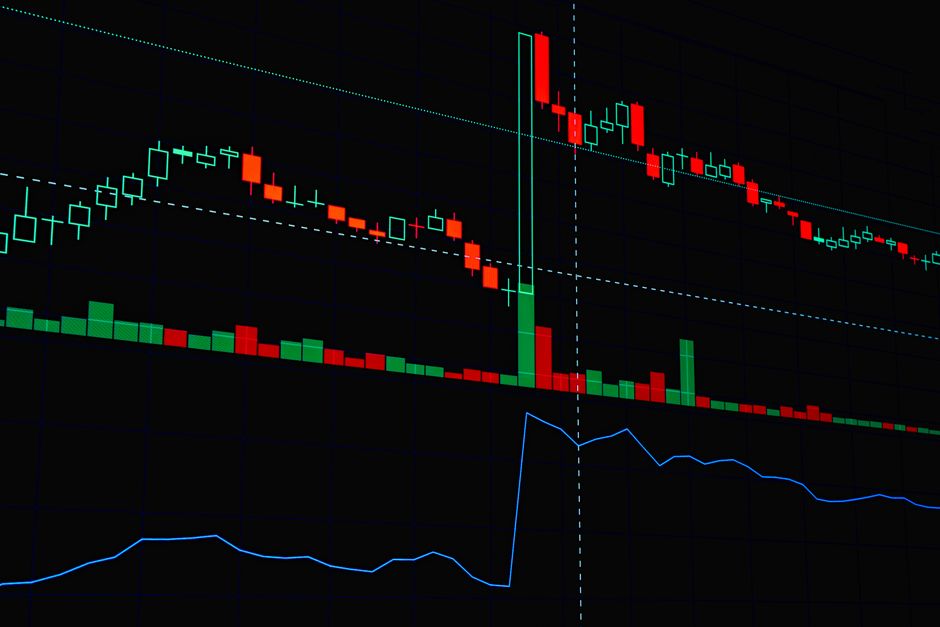
The second shape spends almost the entire period pressed against one edge. Price opens, moves to the high within a few minutes, and stays in the upper portion, dipping once or twice without conviction. The low of the range is not a level anyone defended. It is simply the furthest price happened to travel during a single shallow pullback.
This matters in two directions. A break of the high has less significance than it looks, because price was already there and the level was never really rejected. But a break of the low is more significant than it looks, because it requires price to travel through the entire range it had refused to enter, which is a real change in behaviour rather than a continuation.
Placing a stop at the opposite edge of a one sided range also means placing it at a level with no history of support, which is a different proposition from placing it behind a level that was tested and held.
The Two Push Range
The third shape forms in two distinct movements with a quiet stretch between them. Price makes an initial move, settles, then makes a second move that extends the range in the same or the opposite direction. The range is the sum of two separate episodes rather than one continuous auction.
The important question is whether the second push extended the range or reversed within it. A second push that extends in the same direction suggests the first move was not exhausted and the period simply ran out before the move did. A second push in the opposite direction that establishes the other edge is closer to the balanced case, arrived at by a different route.
Deciding What You Are Looking At
None of this requires a tool. It requires looking at the period before drawing the lines and asking where price actually spent its time, how many times each edge was touched, and whether the extremes were defended or incidental. The answer changes what a break of either edge means and, more practically, whether the opposite edge is a sensible place to put a stop.
The shapes are not a classification system to be applied rigidly, and plenty of sessions sit between them. The value is in the habit of asking the question at all, because a range described only by its high and its low is a range you have not really looked at.